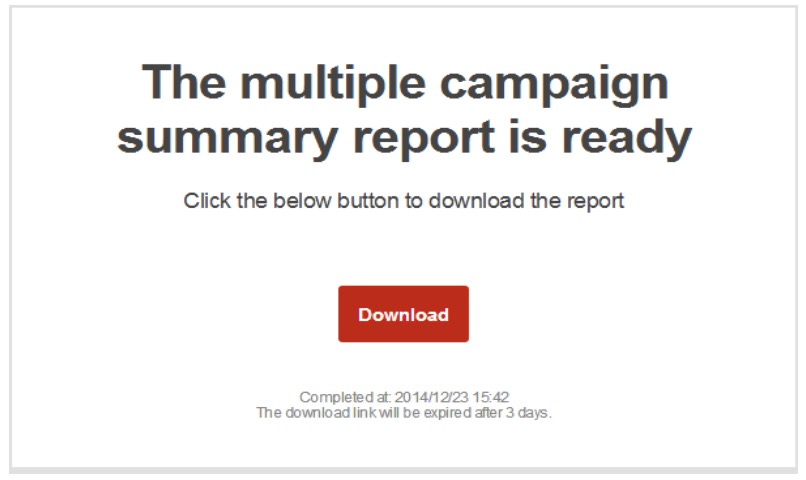
RiMANGGIS helps users to generate insights report which is used to analyze the activity trend of multiple completed campaigns in specified time range. Users can specify a time range to generate and view insights reports.
Users can open database menu and click ‘Multi-campaign report’ to enter the page of multi‐ campaign report.
Set Date Range
You need to select the date range to view specified campaign reports.
Click the filter icon in the left top corner of the page to select the date range from drop down list options.
- You can choose to view campaign reports in last 3 months, last 6 months or last 3 years. The number value in brackets stands for the total number of campaigns in specified date range.
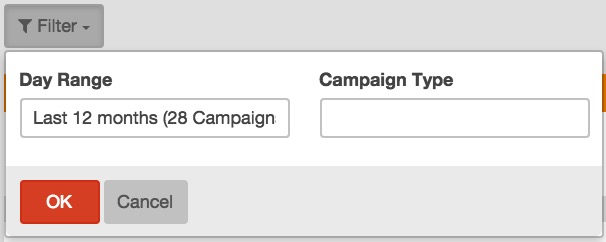
- You can select the option ‘Customized’ to specify a special date range. You need to set the campaign start date and end date. The customized date range cannot exceed 3 years.
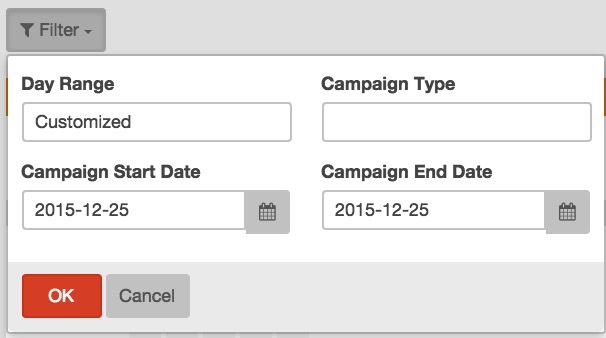
- You can specify the campaign type of which report you want to view. If the campaign type is not specified, RiMANGGIS will collect all the statistical data of all campaign type by default.
View campaign chart
Summary information
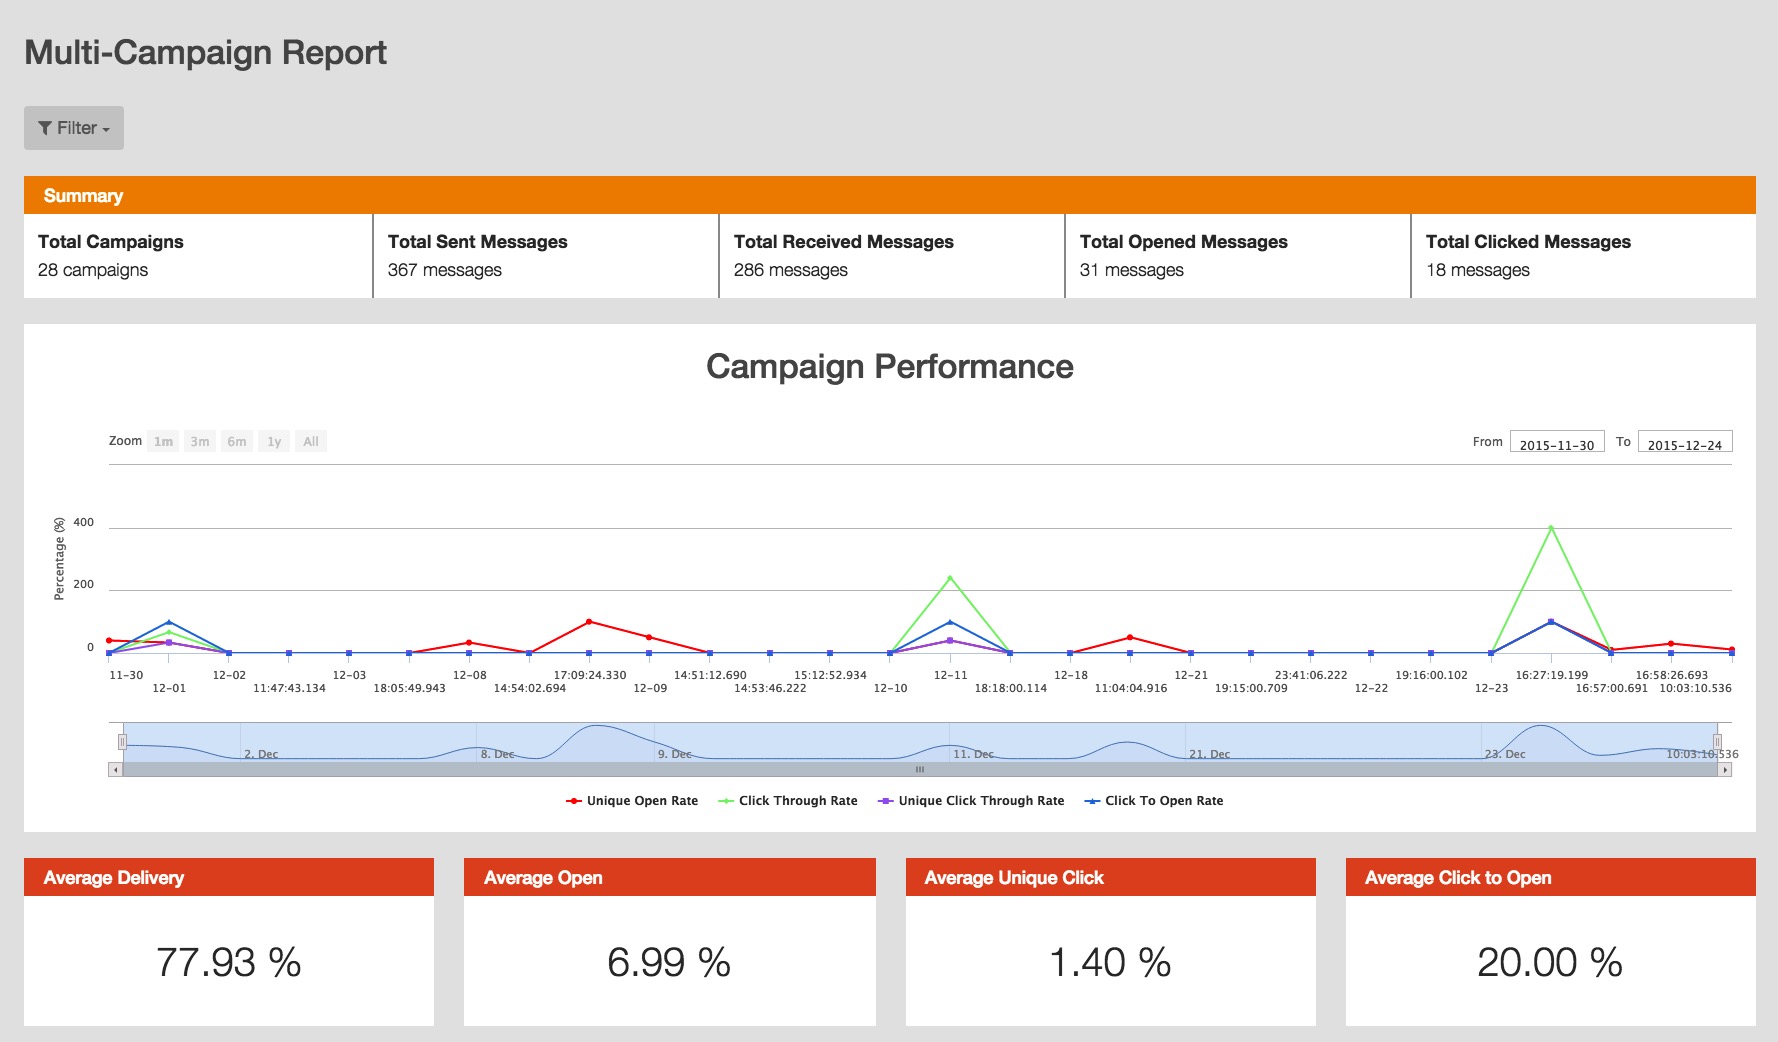
RiMANGGIS automatically collects the statistical data of completed campaigns in specified date range, including the total number of completed campaigns, sent messages, opened messages and clicked messages.

View campaign chart
The curve chart displays detailed statistical data including unique open rate, click through rate, unique click through rate and click to open rate.
- The data is described with curves with different colors; you can click the data name below the curve chart to hide the corresponding data curve from the chart.
-
The data nodes on the curve indicate the detailed statistical data of campaigns, you can move your mouse onto the node to view details including campaign name, campaign sent time and percentage data.
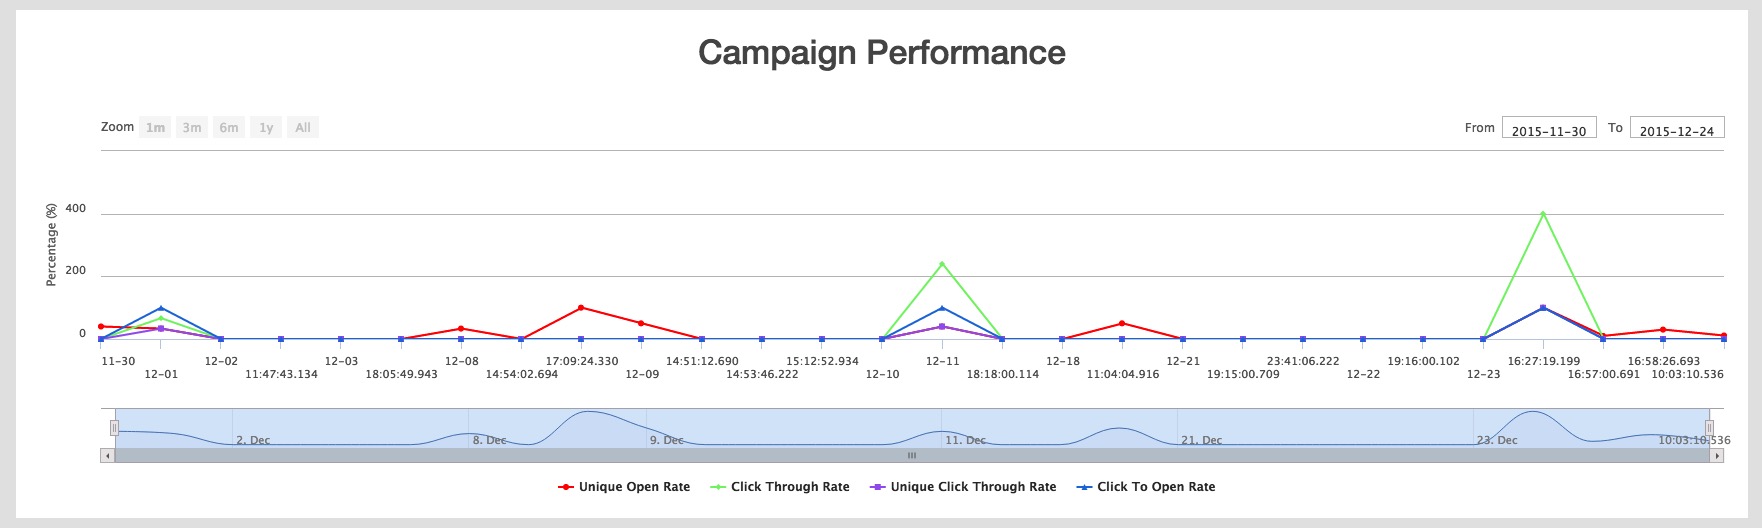
The chart displays all completed campaign data in specified date range by default. If there are large quantities of data in specified date range, you can click the zoom menu to choose a subdivided date period to view corresponding data details.

– Click ‘1m’ to view the data within recent 1 month of specified date range.
– Click ‘3m’ to view the data within recent 3 months of specified date range.
– Click ‘6m’ to view the data within recent 6 months of specified date range.
– Click ‘1y’ to view the data within recent 1 year of specified date range.
– Click ‘All’ to view all data of specified date range.
Time axis and data
The time axis below the curve chart is used to zoom the chart according to time; you can pull or shorten the time axis to select a time period to view data details. The shorter of the time axis is set, the more detailed of the campaign data will be displayed.

You can move your mouse onto the two ends of time axis to set the length of time axis. When the cursor becomes a symbol as a vertical double‐headed arrow, you can drag the time axis to pull or shorten it. The selected time is displayed in the right top corner of the chart.

RiMANGGIS calculates the average percentage data of campaigns within the time axis range. The data is changed according to the settings of time axis.

The formula for calculating average percentage data of selected time axis is described as follows: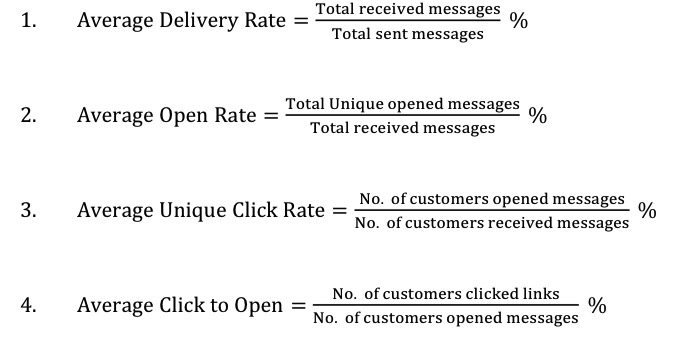
View Campaign information
RiMANGGIS collects the campaign information within selected date range according to the filter conditions set by users. It also analyzes the statistical data results of open rate, click through rate, unique click through rate and click to open rate, and then lists the top five campaigns by descending order.
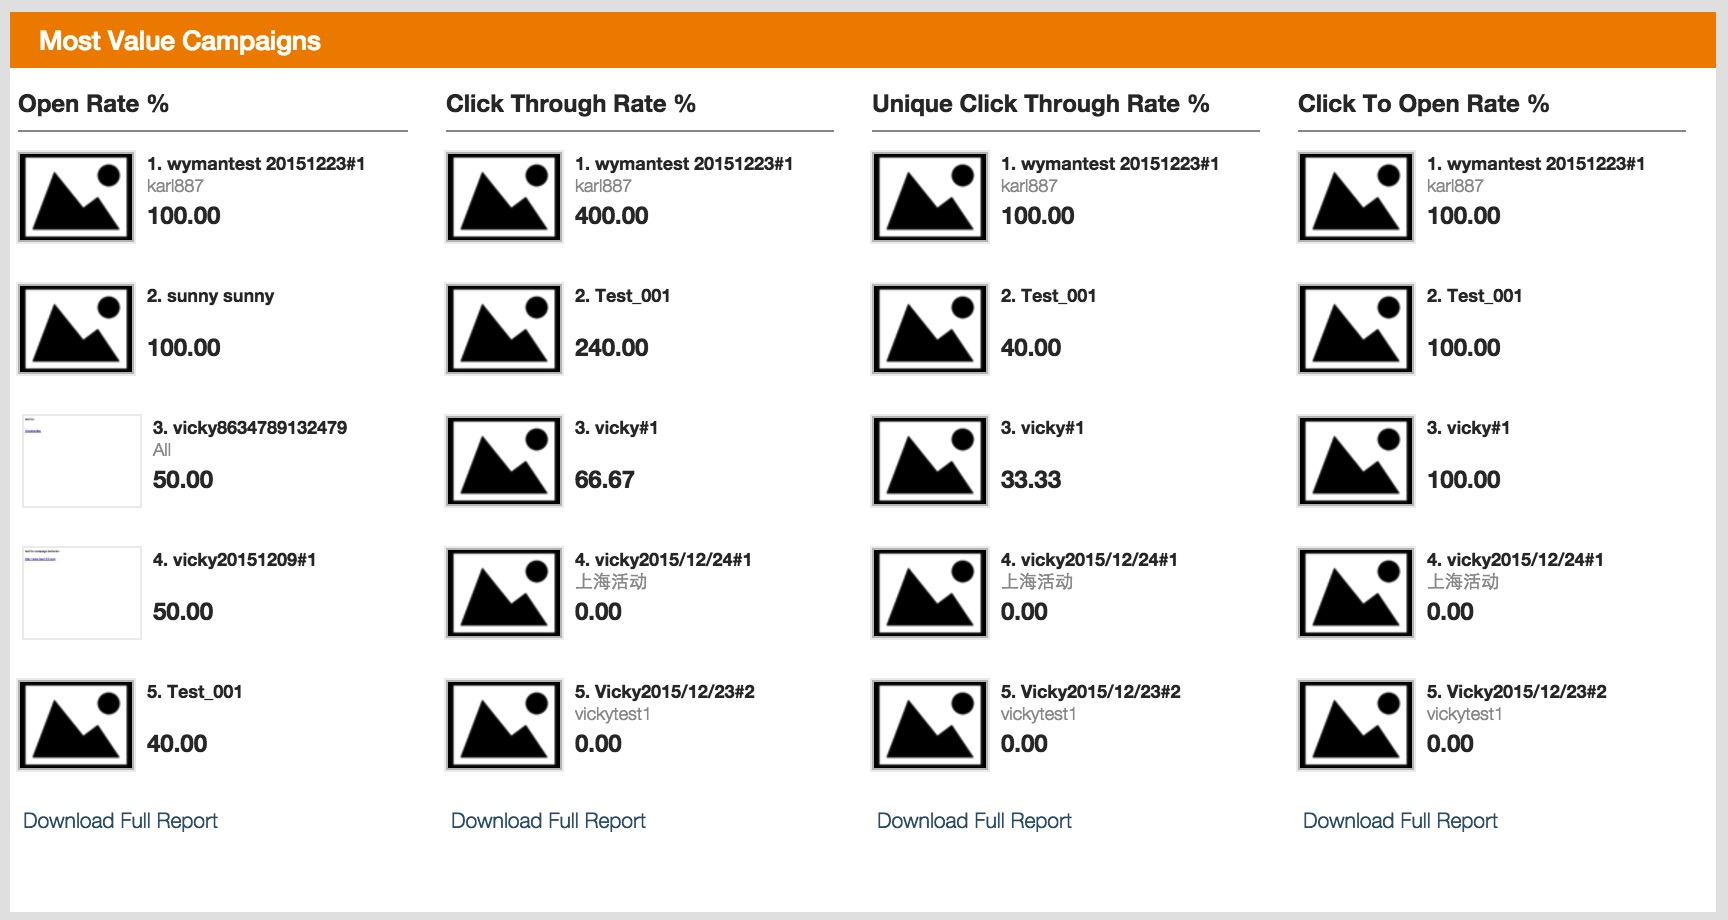
- Open rate list: RiMANGGIS calculates the open rate of campaigns in specified date range and lists the top five campaigns.
- Click through rate list: RiMANGGIS calculates the click through rate of campaigns in specified date range and lists the top five campaigns.
- Unique click through rate list: RiMANGGIS calculates the unique click through rate of campaigns in specified date range and lists the top five campaigns.
- Click to open rate list: RiMANGGIS calculates the click to open rate of campaigns in specified date range and lists the top five campaigns.
You can click the campaign thumbnails to view the html page of campaigns.
If you need to view the detailed report information of campaigns, you can click the download link below the campaign lists to export complete data reports. No matter which download link you click, the exported CSV file will be the same report. The exported report includesallthestatisticaldata suchasdeliveryrate,openrate,socialmediasharetimes. The sequencing order of the data rows in report file depends on the download links users click. For example, if you click the download link of the open rate list, the data rows will be sequenced by open rate in descending order.
After you click the download link, RiMANGGIS will execute the export task in background and then send a notification email to your mailbox after the file is successfully exported. You can click the download link in the email or the export notification column to download the exported CSV file.