About dashboard
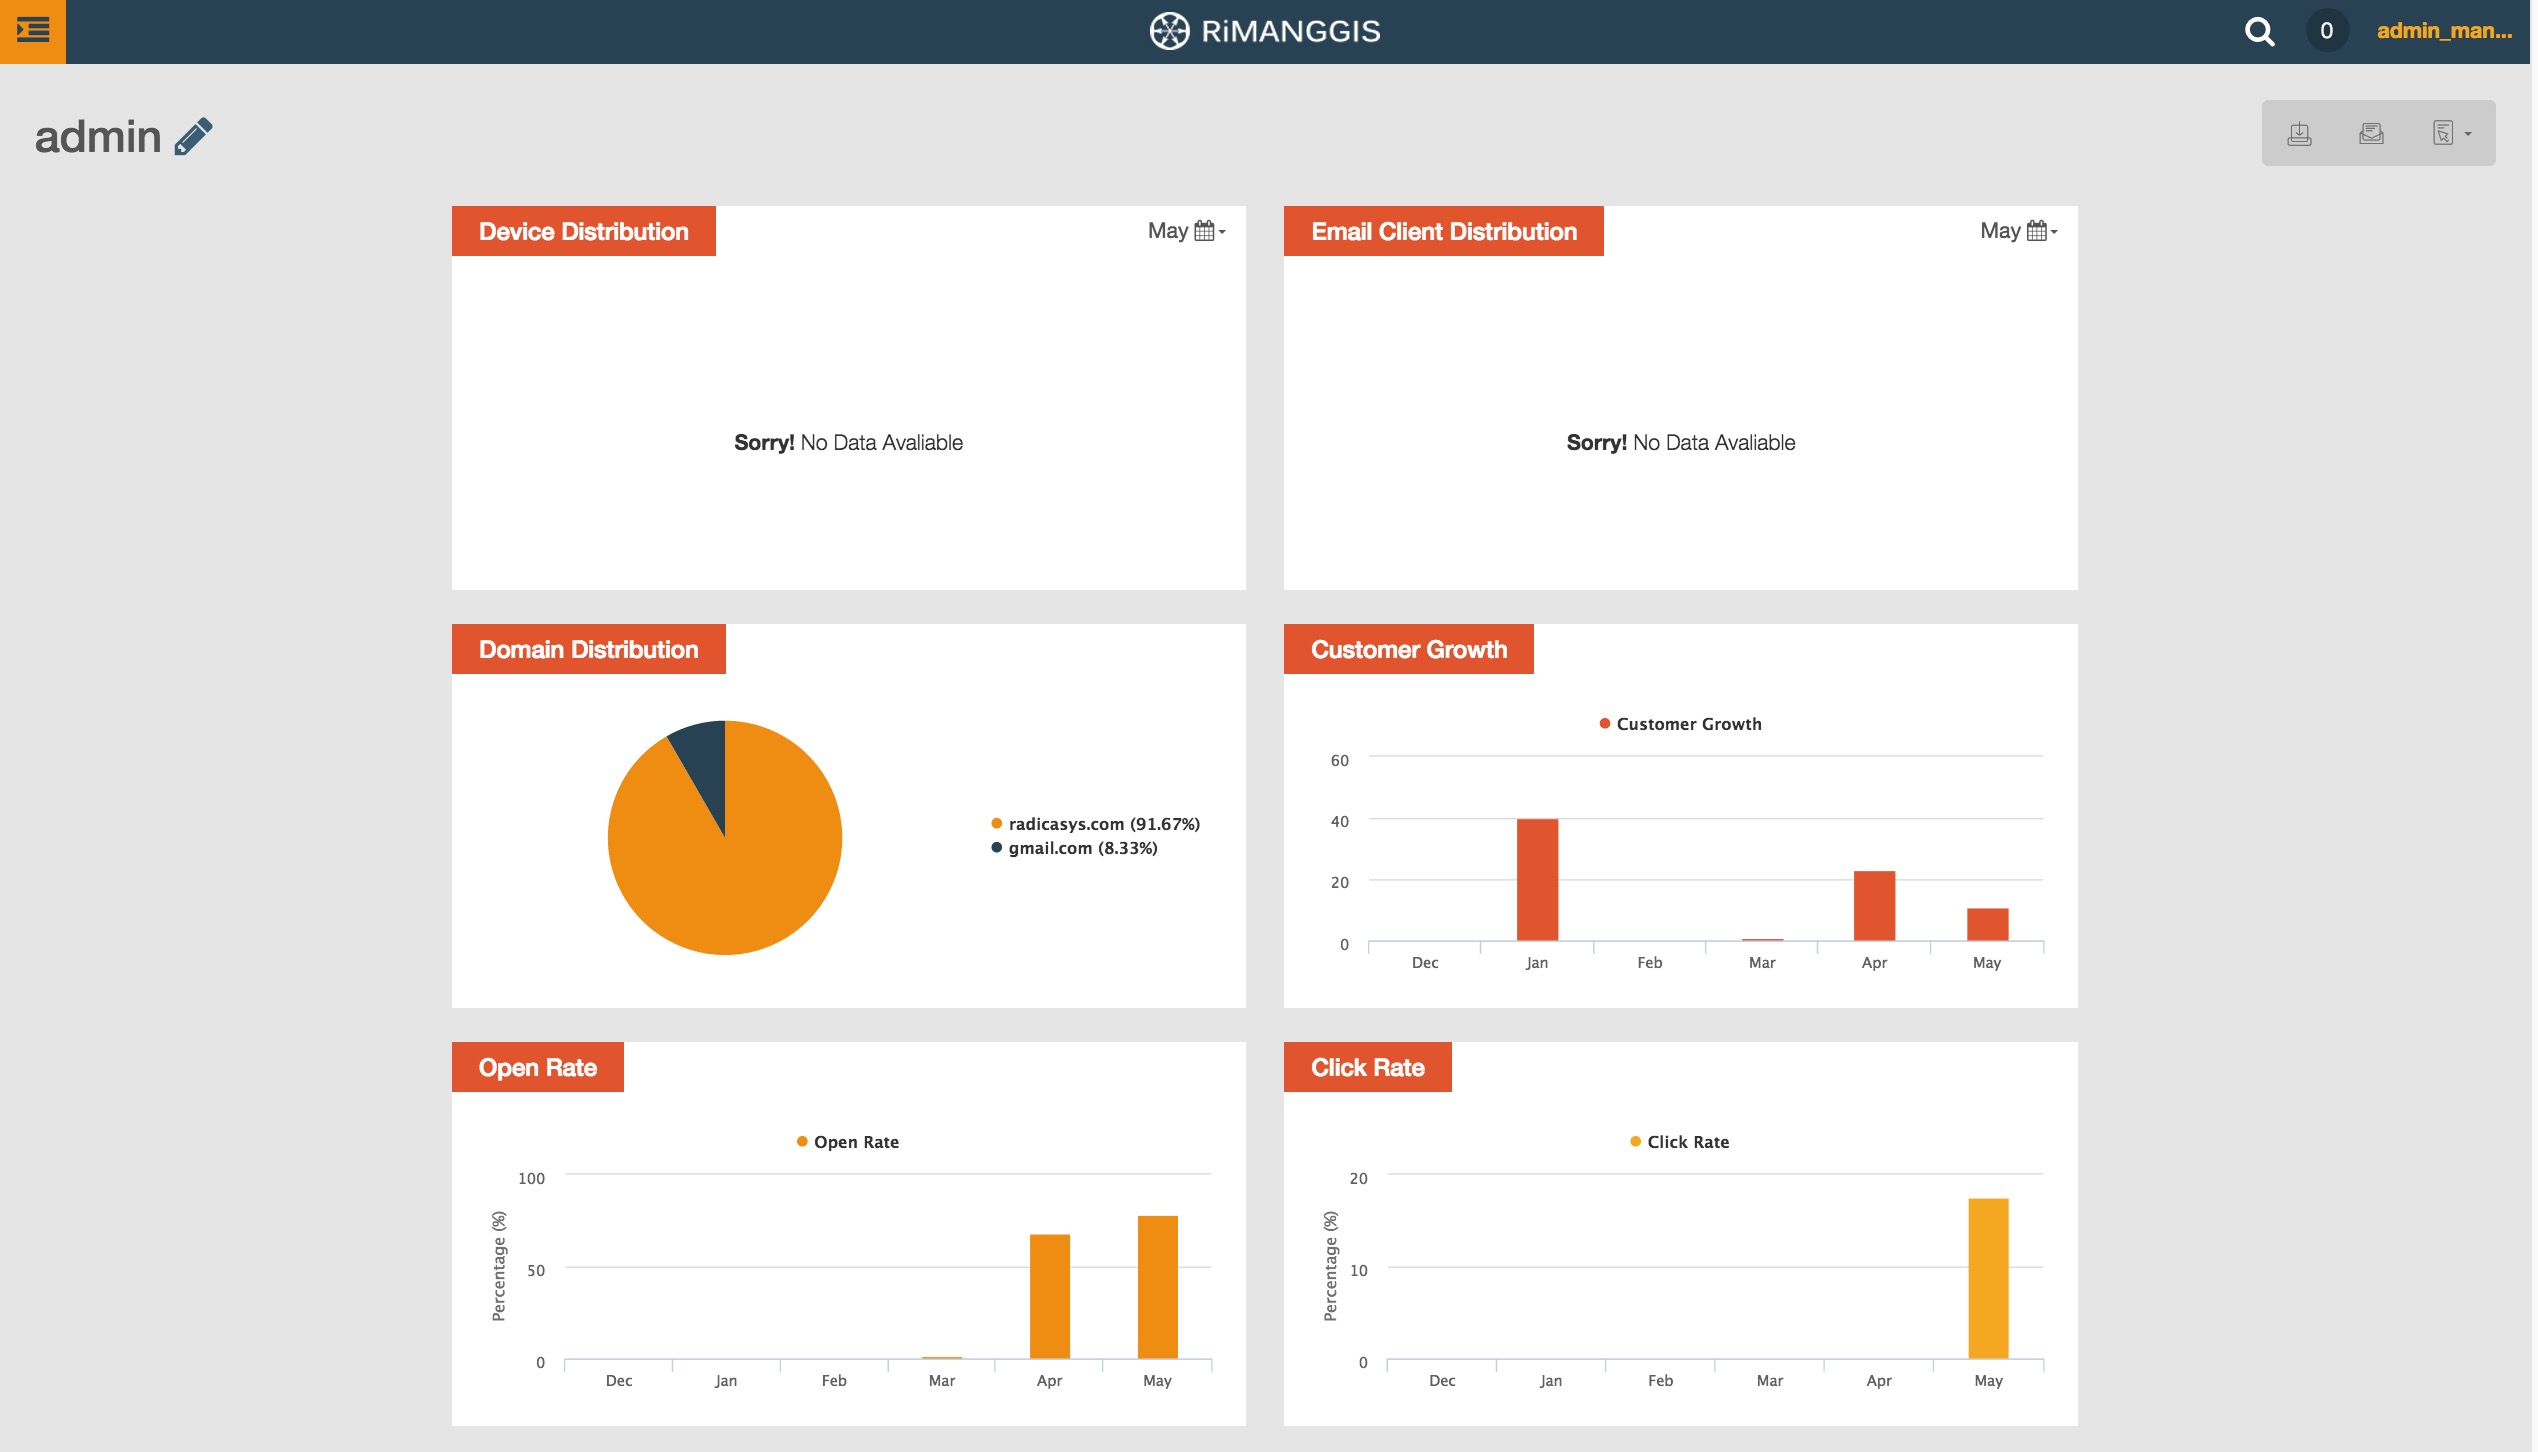
Dashboard provides an overview about your customers and campaigns, it is the default display page after you sign in to RiMANGGIS. You can also extend the operation side menu and click ‘Dashboard’ to view dashboard page.
Edit database name
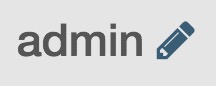
Your database name displays at the top left corner of dashboard page. You can modify your database name.
↓
1. Click the edit icon beside your database name.
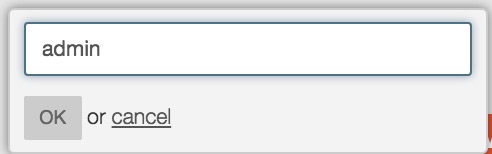
2. Input your new database name.
3. Click ‘OK’ to save your new database name.
Your database name will take affect after you log in to RiMANGGIS next time.
Shortcut button
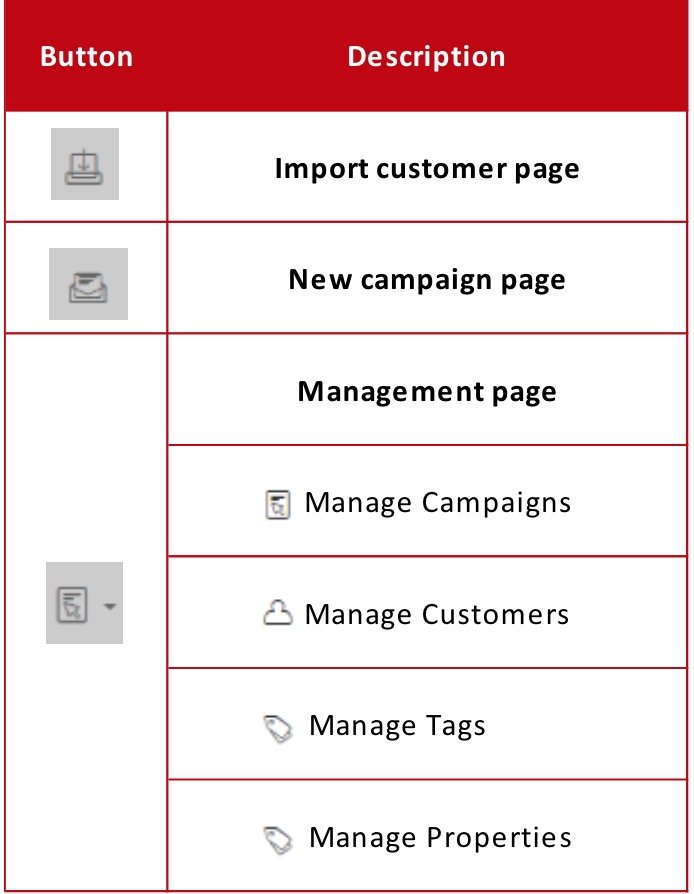
You can use the the shortcut button in the right top corner of dashboard to quickly enter related operation pages.
View dashboard report
The dashboard displays data from different aspects in nine chart reports:
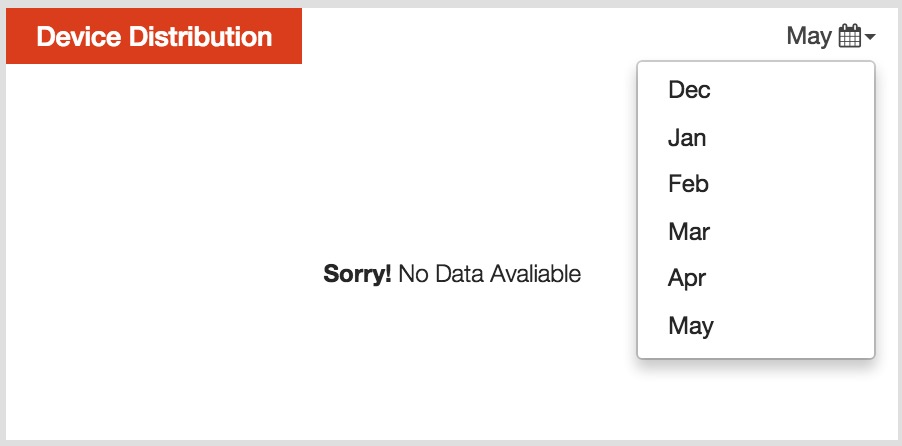
- Device Distribution: Devices can be classified into three categories: PC(personal computer), smart phone and tablet. After campaigns are sent to customers, RiMANGGIS will automatically collect customers’ device and operating system information and display distribution rate in pie chart.
- Email Client Distribution: After campaigns are sent to customers, RiMANGGIS will automatically collect customers’ email client information and display the distribution rate in pie chart.
- Domain Distribution: RiMANGGIS collects all the email domain information of customers in database and displays the statistics rate in pie chart.
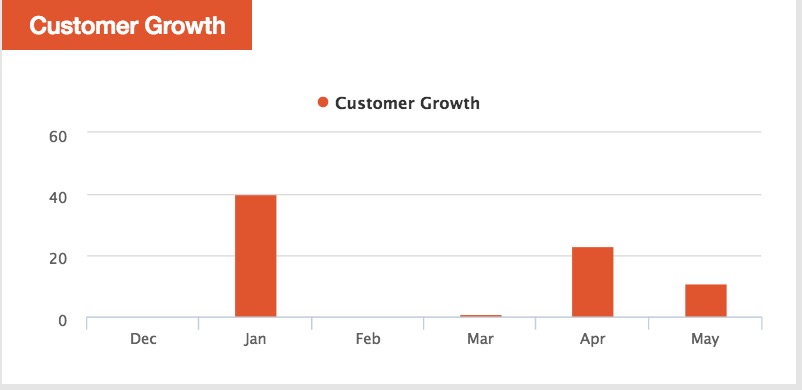
- Customer Growth: RiMANGGIS will calculate the number of customers by month and displays monthly statistical data in bar chart. From the chart, users can view the change of every month customer records and know customer growth trend.
- Open Rate: After campaigns are sent to customers, RiMANGGIS will calculate the number of customers’ open operation and displays monthly campaigns open rate.
- Click Rate: After campaigns are sent to customers, RiMANGGIS will calculate the number of customers’ click operation and displays monthly campaigns click rate.
- Spam complaint rate: After campaigns are sent to customers, some customers probably regard the received campaigns as spam and submit complaint. RiMANGGIS will automatically collect their complaint behavior data and display monthly spam complaint rate. This chart helps users to improve campaigns and reduces customers complaints.
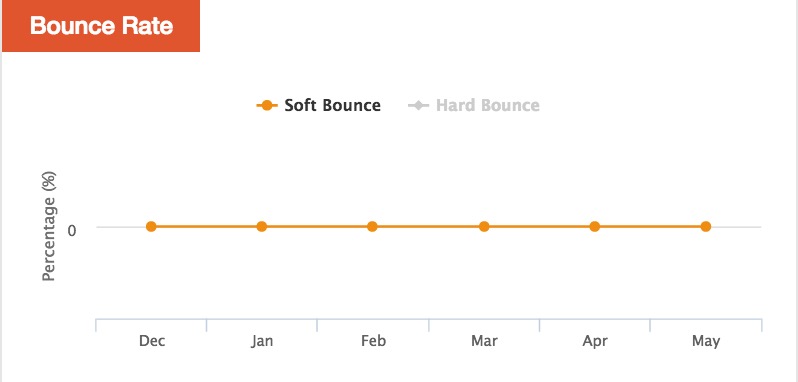
- Bounce rate: Email bounce is divided into hard bounce and soft bounce. Hard bounce indicates campaigns are bounced because of problems such as client error, domain error and email address error. Soft bounce indicates campaigns are bounced because of customers mailbox settings such as the full capacity of mailbox. Bounce rate chart helps users to understand monthly bounce rate and improve campaign delivery rate.
- Unsubscribe rate: display monthly campaigns unsubscribe rate. If customers choose to unsubcribe campaigns, RiMANGGIS will timely retrieve customer unsubcribe behavior and displays the unsubscribe rate.
All the charts display monthly report except domain distribution.
- You can move your mouse onto the section you want to view in chart to see detailed data. For example, if you want to view the customer growth rate in May in Customer Growth chart, you can move your mouse onto the data bar of May to see the exact value.
- You can click the data name to hide the corresponding data from charts, the shielded data name will display in gray color. For example, in bounce rate chart, if you only want to view the soft bounce curve graph, you can click ‘Hard Bounce’to hide the hard bounce curve graph from chart.
- In pie chart, if users click a data name to hide related data field from charts,RiMANNGIS will shield the hidden data and recalculate the proportions of other data fields.
- In other charts, if users hide a data field from charts, RiMANGGIS merely hide the display of the data field,the proportion value of other fields will not change.